wake
An instrument for drawing the trace a line leaves as it moves through time. This is how it was made: by taking another tool apart, finding what it couldn't do, and letting a pen plotter overrule me twice.
01Taking a tool apart
The starting point was uji by Noah Doersing, a lovely browser toy with fifty sliders and forty presets. Rather than reskin it, I read its source to find the one idea underneath. One line is redrawn every step and nudged a little each time, and every step stays on the page. The sliders are just numbers in a single, fixed recipe: shake, then shrink, then move, then wave, then turn.
Two things fell out of that reading. First, its share links weren't reproducible: randomness was unseeded, so the same link drew something different every time. Second, every part of the line lived in the same moment.
02The idea that didn't work
I wanted each part of the line to keep its own clock. My first attempt shifted the rotation's timing point by point. I swept it across 300 renders, and nothing happened.
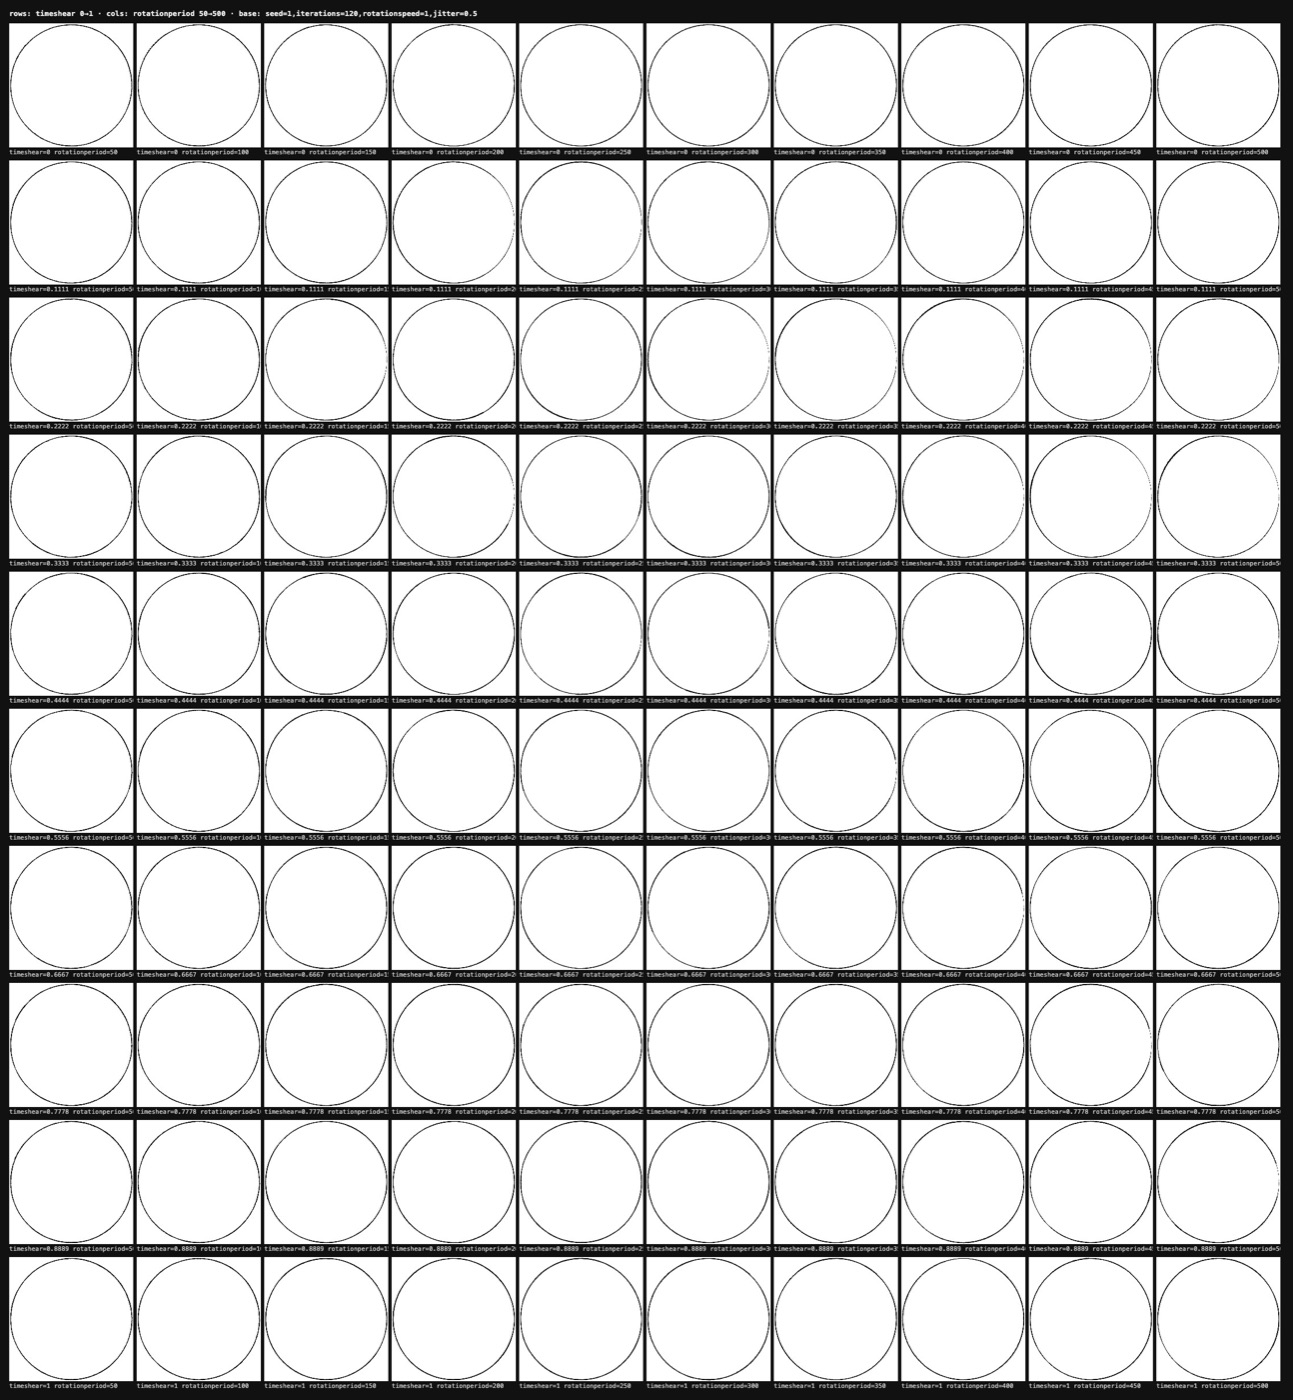
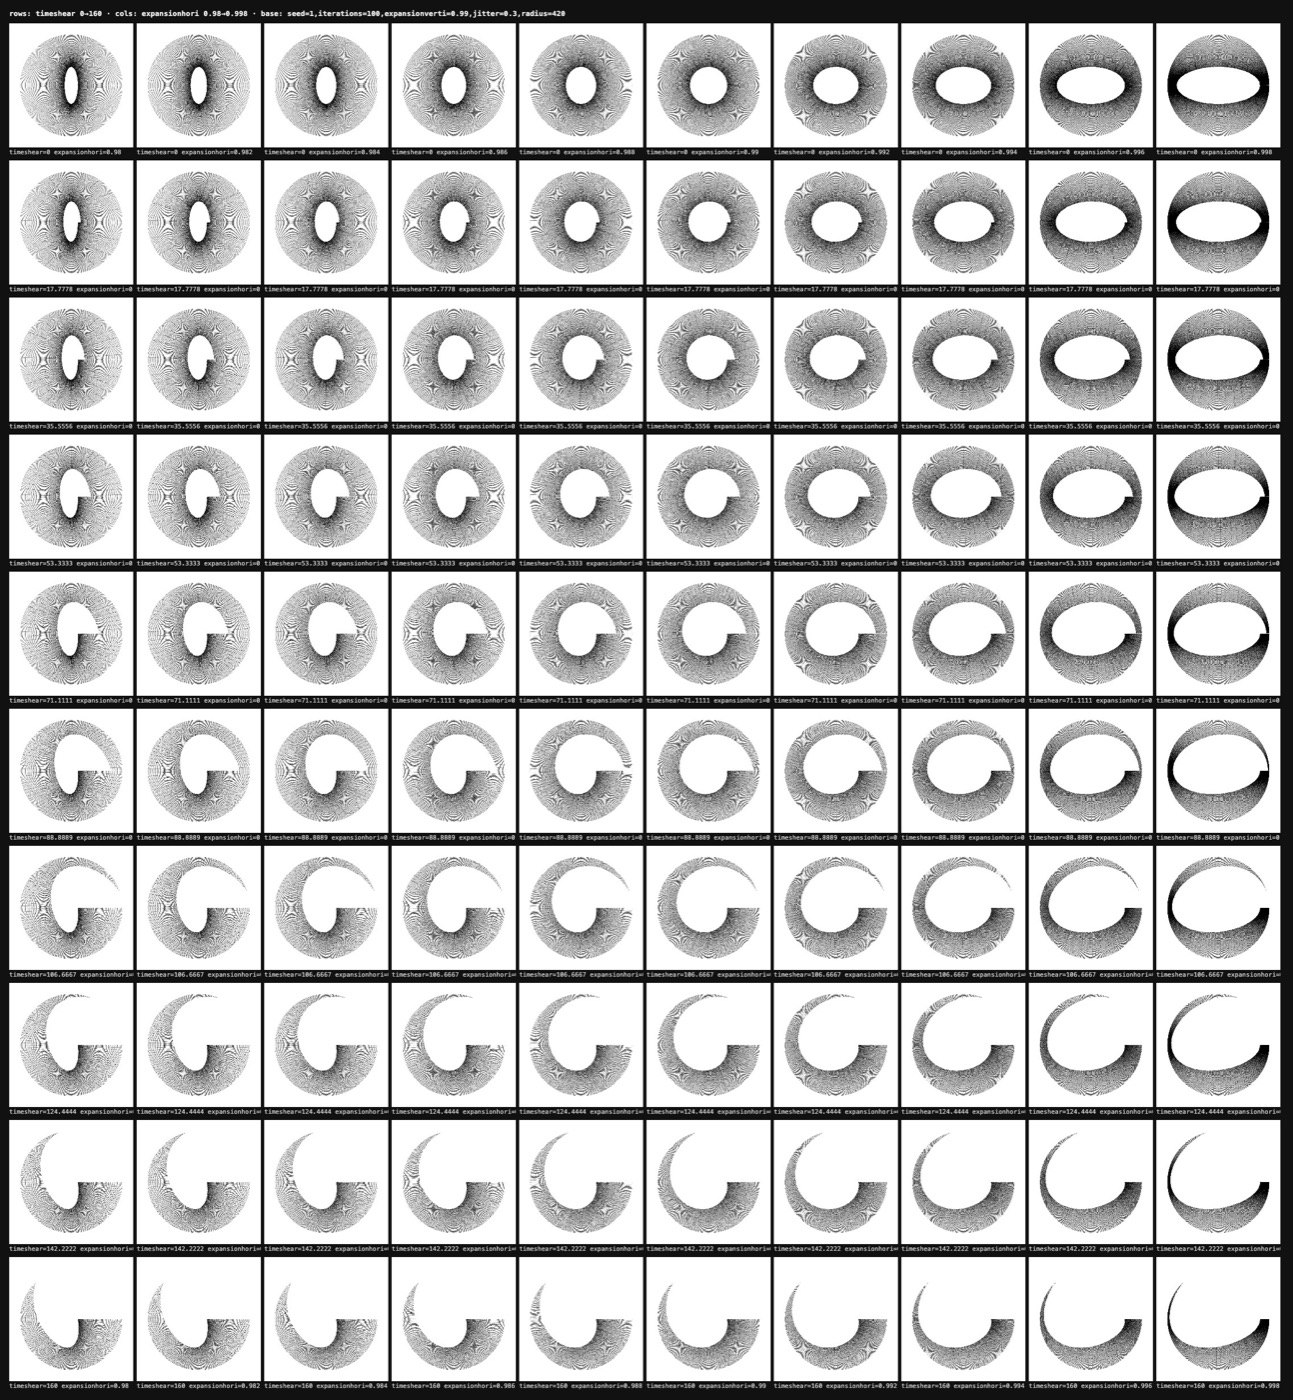
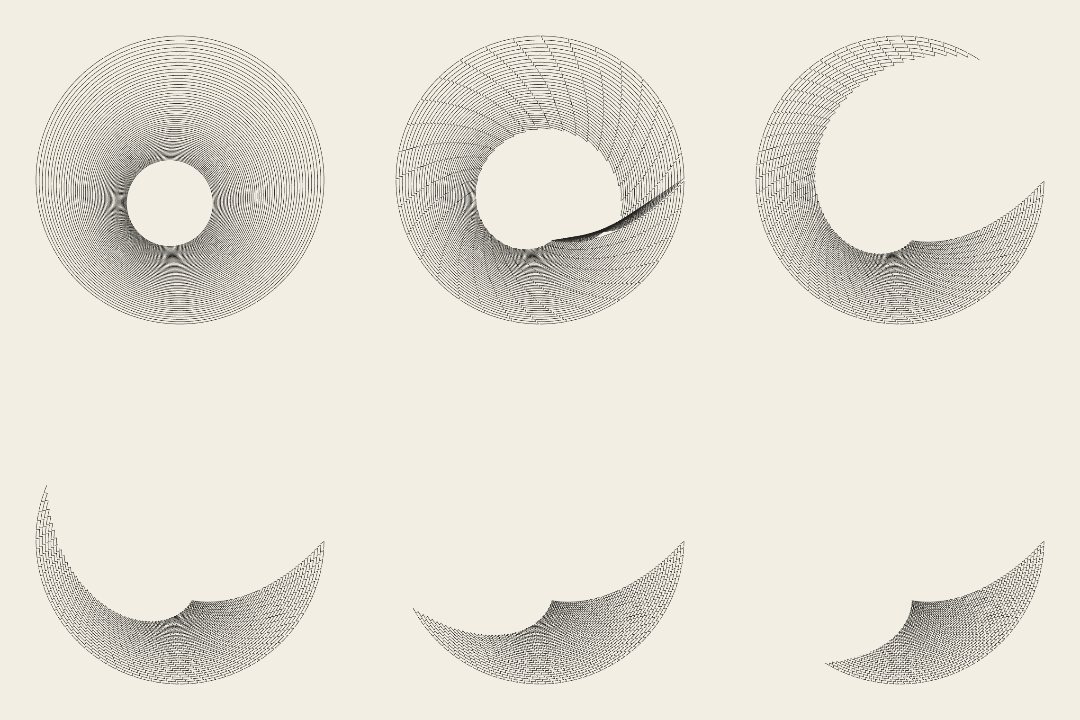
The grid made the bug obvious in a way that tweaking one slider never would. The fix was more radical: a point whose moment hasn't come yet is neither drawn nor moved. When it begins, it joins a line whose other parts have already travelled.

03The 957-minute drawing
I wanted these on paper, drawn by a pen plotter, so I wrote a checker that estimates plot time and how much ink lands on each 2 mm square. A typical render from the original tool came back at 957 minutes and 2.1 km of ink, with thousands of squares that a pen would scrub through.
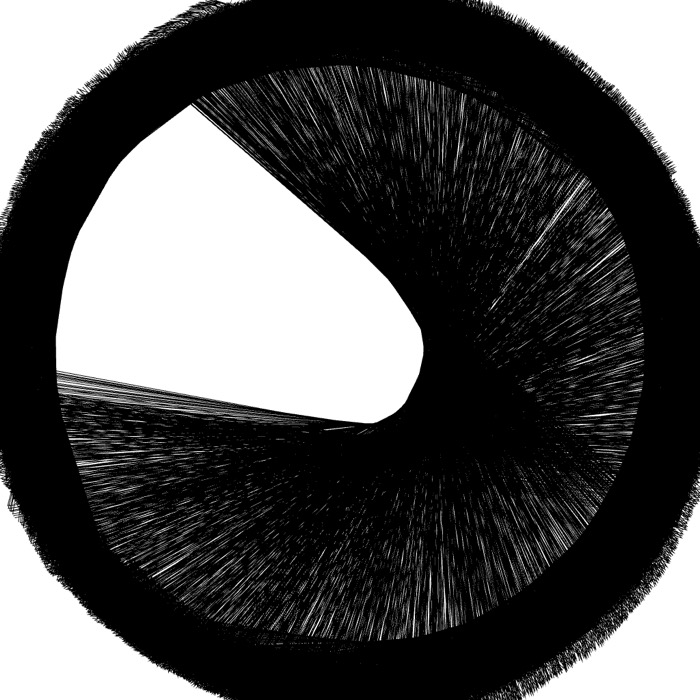
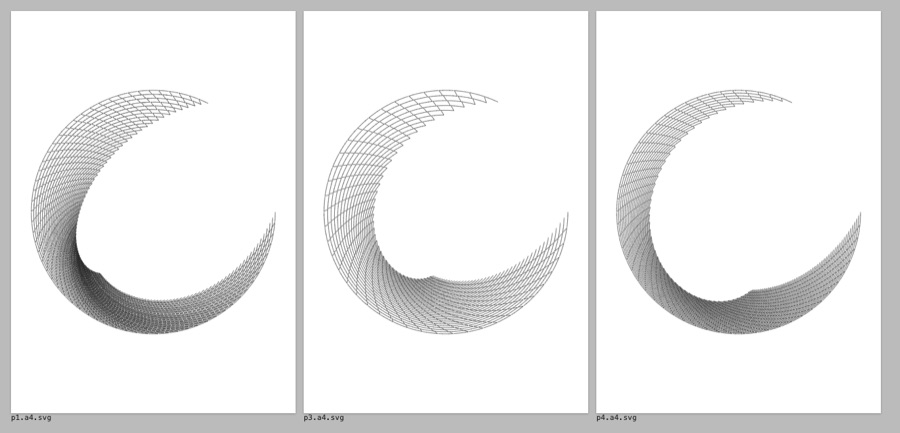
Going sparse wasn't a compromise. On paper the drawing became a net of short arcs, which reads better than the dense version did on screen.
04The paper chose circles
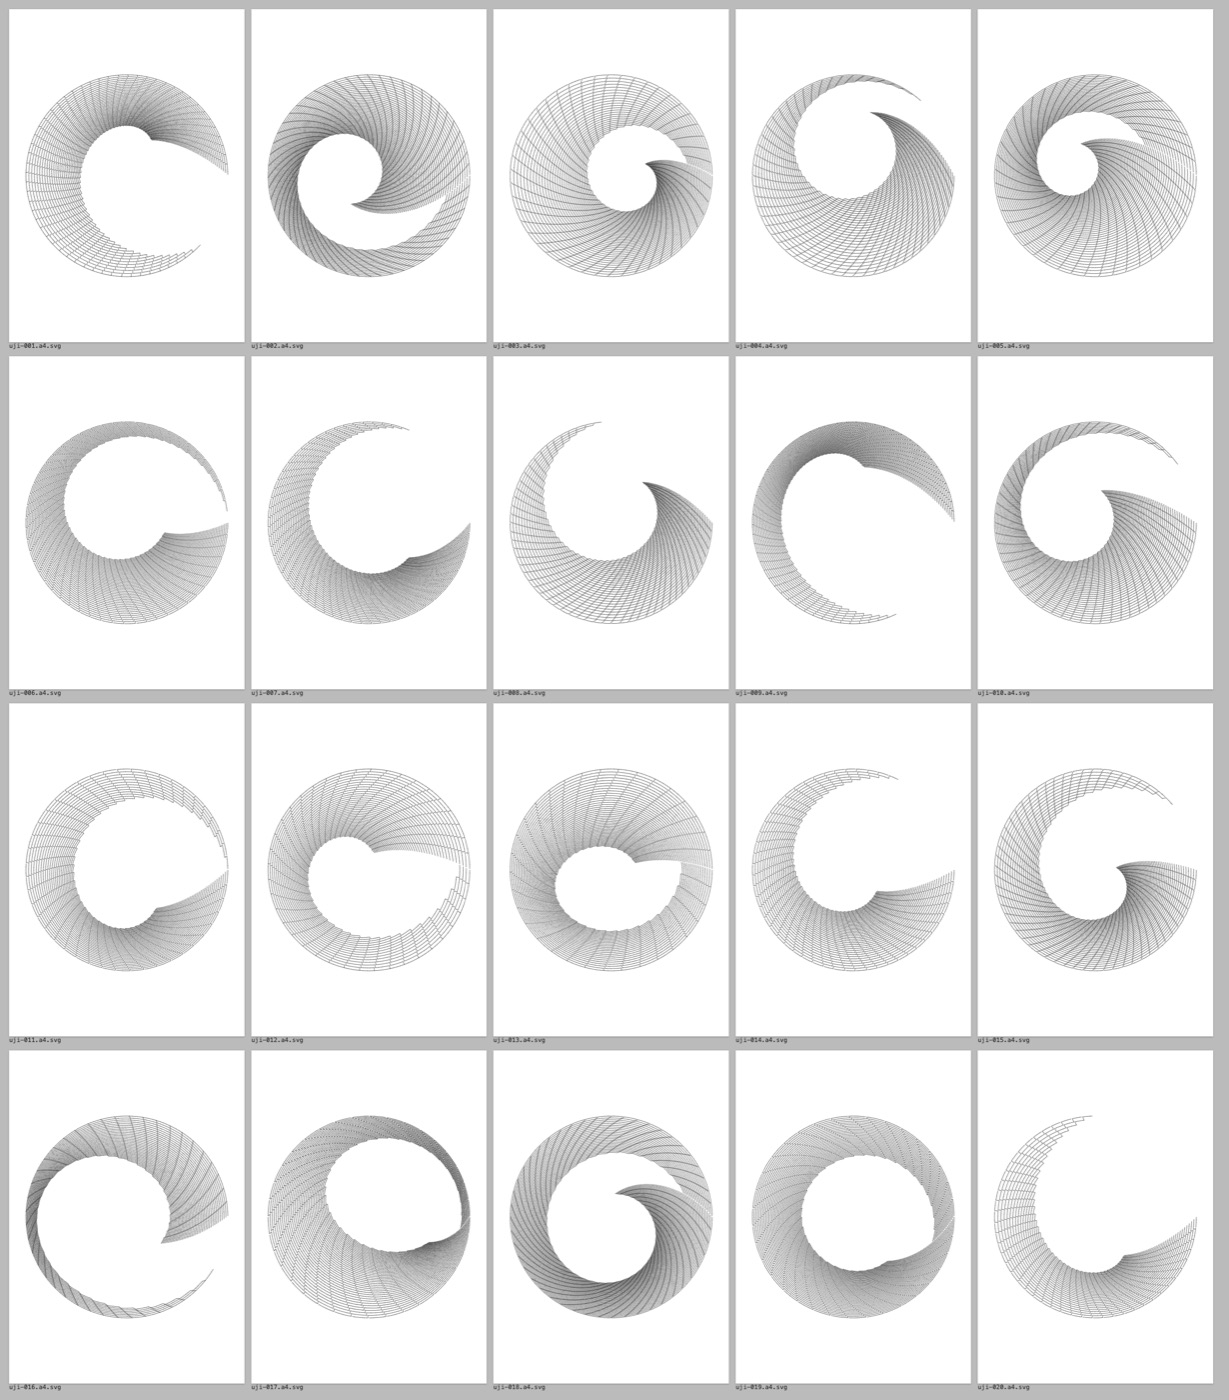
I made a seed decide every parameter, then let the plot checker reject anything that would over-ink. On the first pass only 7 of 20 survived. Every square and every triangle failed, because their corners fold the line back onto itself. After tightening the ranges and re-rolling the failures, all 20 passed, and all 20 were circles.
05Building my own instrument
wake is written from scratch, keeping the idea and none of the code. A drawing is a seed shape plus an ordered stack of blocks (rotate, scale, move, wave, jitter, swirl, attract, delay) that runs once per step. Any value in any block can drift over time, along the line, or both. Every point keeps its own clock. The whole drawing lives in the link, and the same link always gives the same drawing.
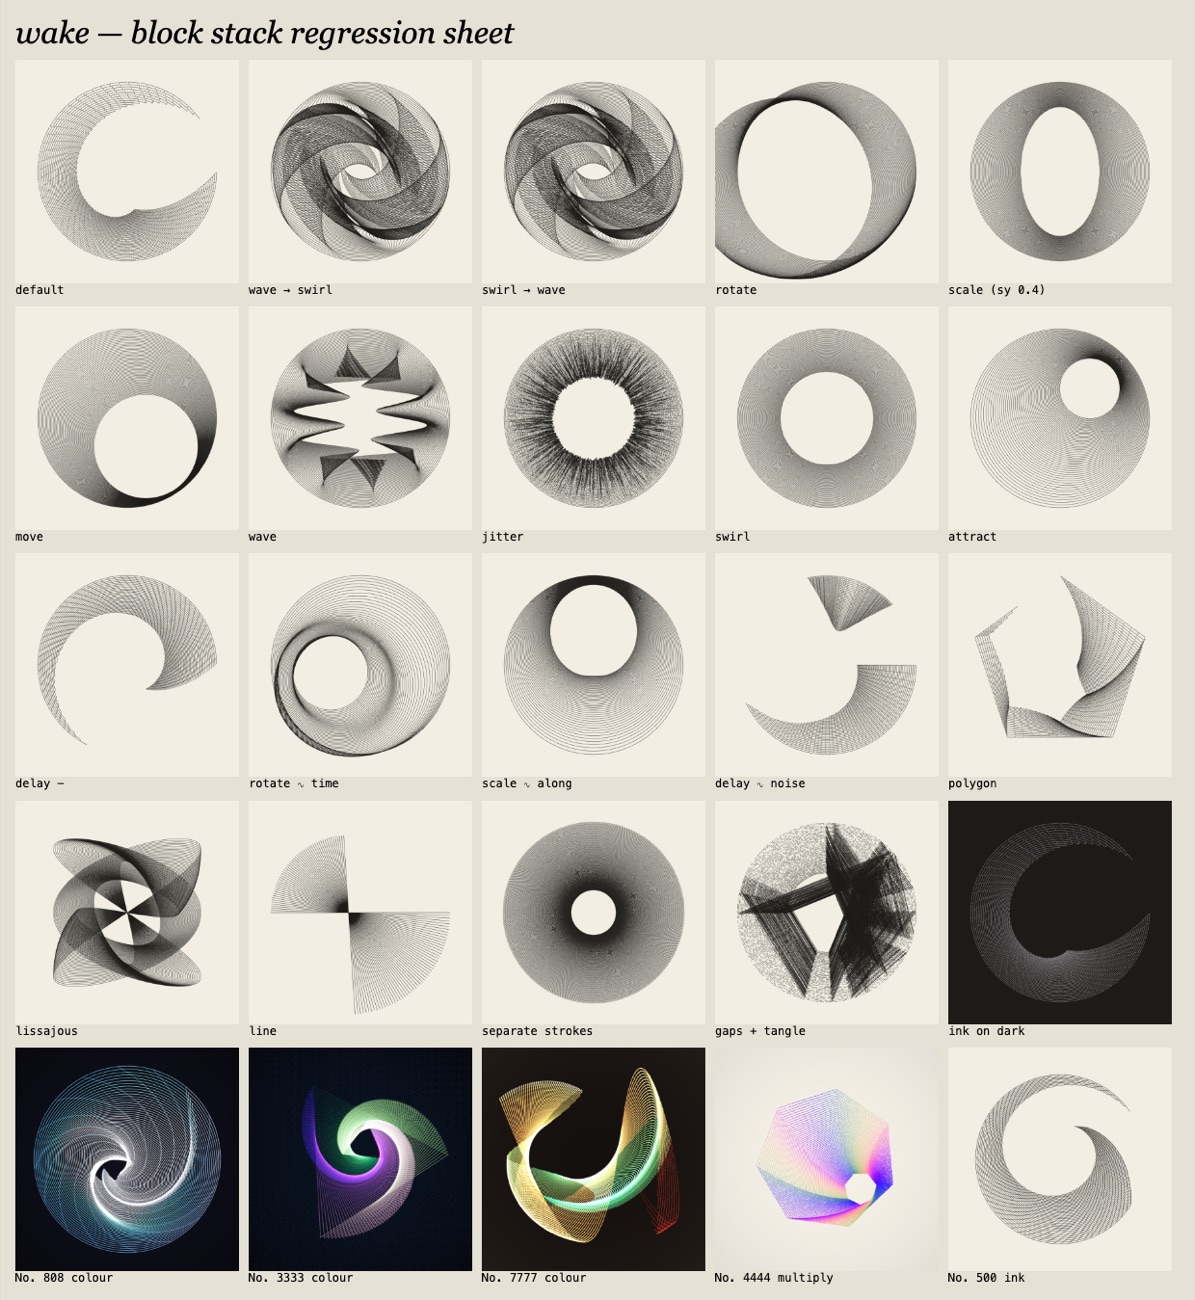
I expected order to be the headline: shuffle the blocks and get a new drawing. The tests said otherwise. With small steps, "scale then rotate" and "rotate then scale" are almost indistinguishable. Two near-identity transforms differ only by a second-order term. Order only shows with nonlinear blocks like wave and swirl. So the stack's real power is composition, and the interface says so.
Every visit without a link starts from a new stack. The drawing then drifts: each value breathes slowly around where you set it, so wake is never quite the same twice, but it's always yours to steer. Hold freezes the exact frame into a link.
06A collection of 100,000
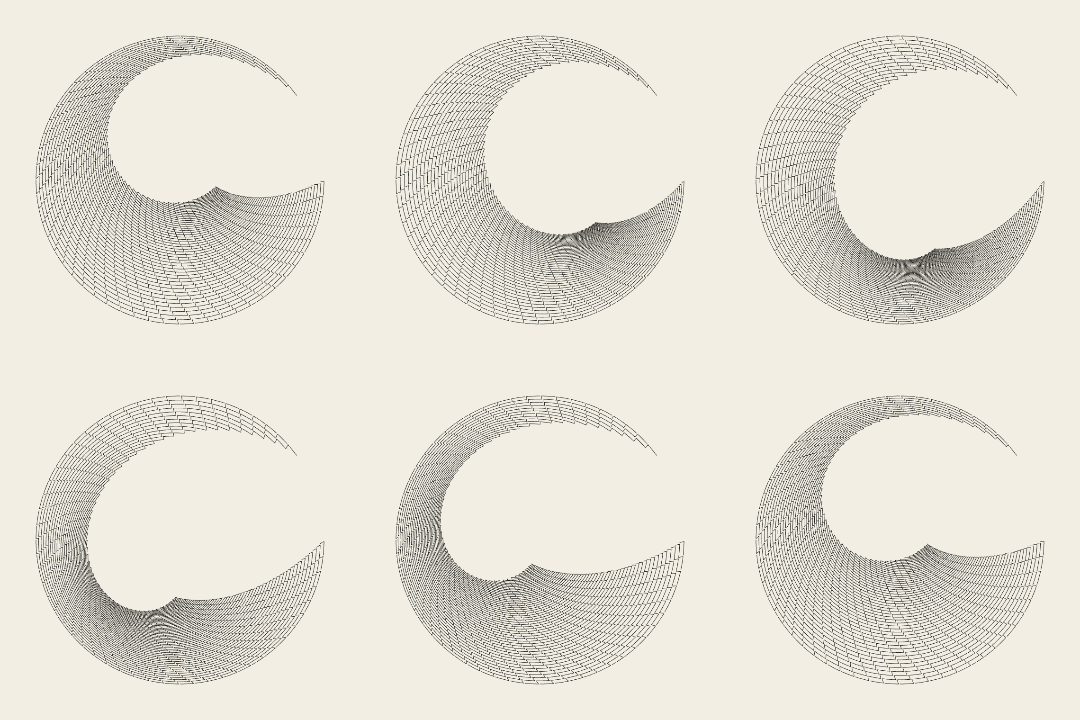
The plotter taught restraint; the screen asked for light. So wake has two kinds of design. Ink pieces are paper and pen, kept inside the plot budget. Colour pieces are light on dark or pigment on paper: gradients that flow along the line and through time, additive glow, soft edges and grain.
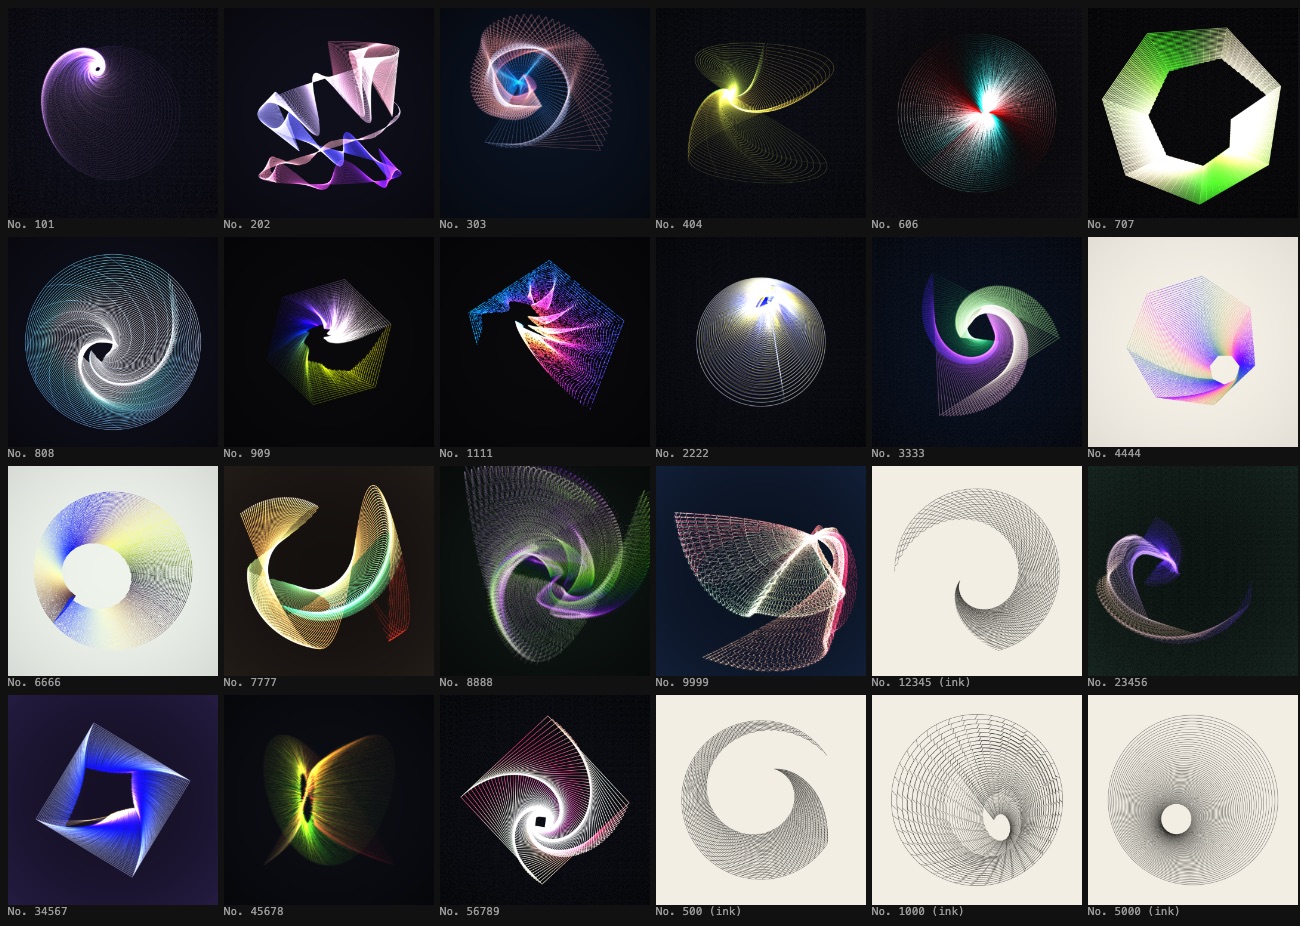
Every number from 1 to 100,000 is one fixed design, and one number in five is an ink piece. A generator tries candidates for each number and judges them on the CPU alone, checking fill, exposure and plot budget, so that No. 48,213 is the same piece on every phone and laptop. A test checks this by generating the same numbers in Node and in the browser and requiring identical results. ✦ colour and ◯ ink pull a random number; editing a design makes it your own.
07It was standing still
The first colour version "drifted": every value breathed slowly around the design. When I measured it on a normal desktop window, nothing moved. Not one pixel changed in ten seconds. Redrawing the whole drawing every frame was so expensive on a large canvas that my own safety check paused it almost at once. The button for a new design was 80 × 27 px, 0.17 % of the screen. The person I built it for told me it looked like it did nothing, and the numbers agreed.
So wake became a simulation. Thousands of line-heads start on the seed shape, each with its own position, velocity and clock. The block stack stopped being a recipe for a picture and became a field of forces, with curl noise added so the flow swirls. Each step leaves a mark on a trail buffer that fades a little every frame. A line-head that has lived its life goes back to the shape, so the flow never ends. Your hand is a force too: drag to stir, hold to pull, right-drag to push, tilt a phone to tip it. Tap or press space for a new design, or press the big ✦ new button.
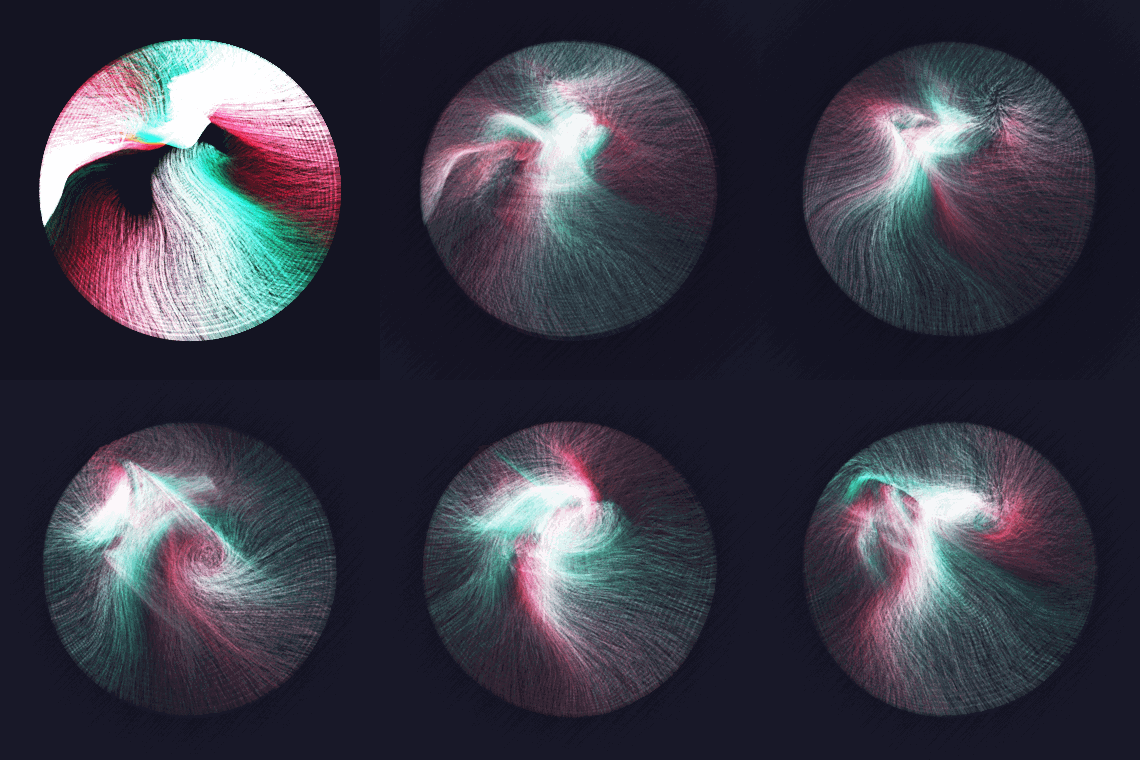
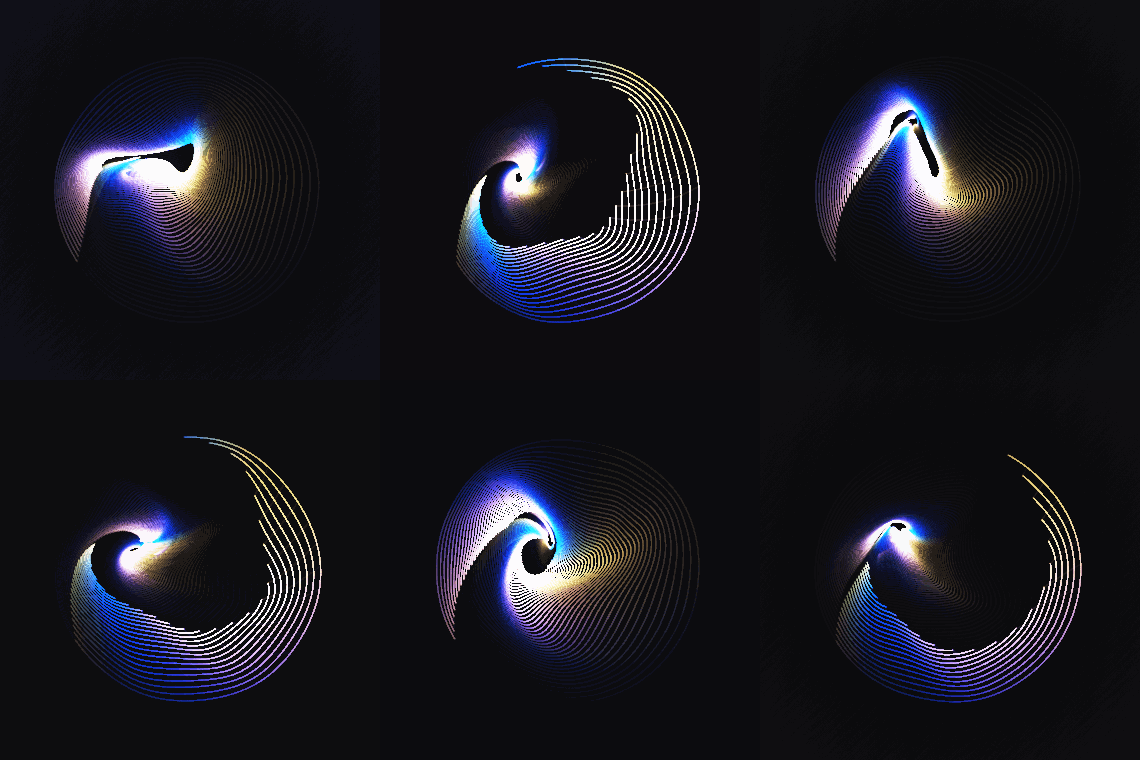
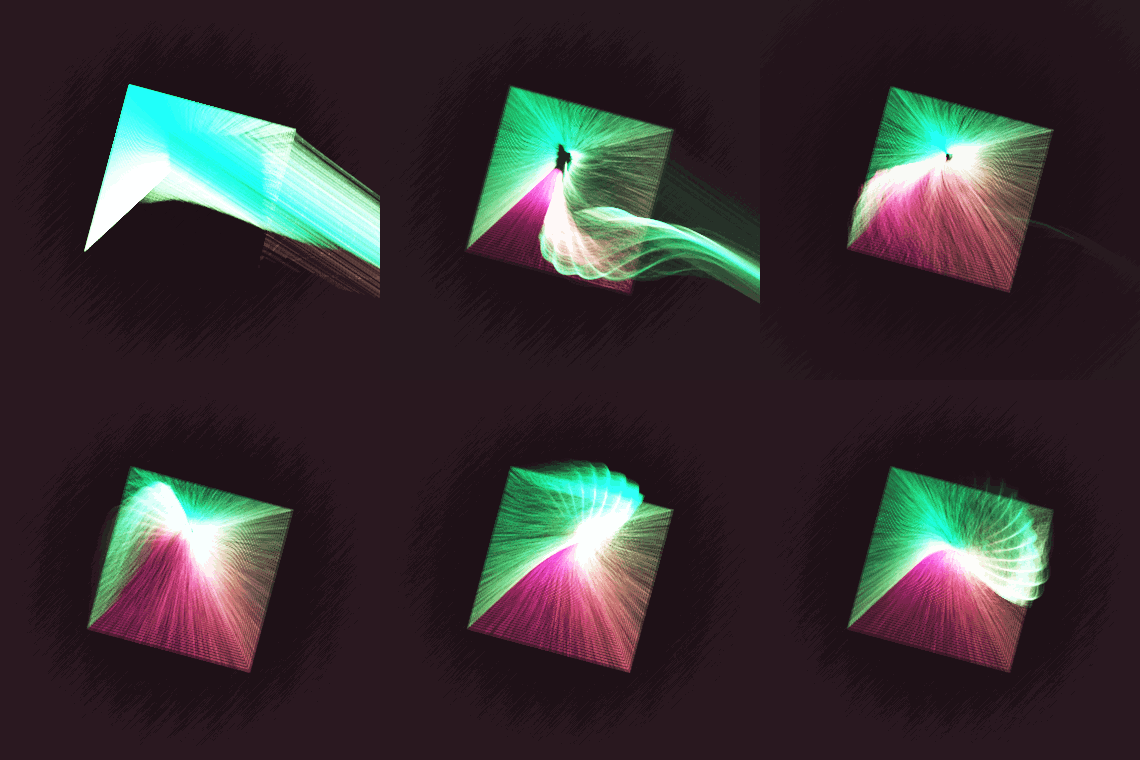
Performance is a design input now. wake measures real frame time for two seconds and picks how many line-heads the device can carry: 8,000 on this laptop and 4,000 on a phone, falling to 500 without a GPU. One bug was worth the lesson: I faded the trail buffer once per simulation step, so a slow frame meant more catch-up steps, which made the next frame slower still. One fade per frame took software rendering from 5 to 35 fps.
08One species to many
Then came the second honest note: everything looks like a waterfall. Before changing anything, I captured 300 numbers from the collection and measured them. Every design had a contracting force, 61 % of them streamed toward the centre, and k-means found just two families. The generator had been making one species in 100,000 colours.
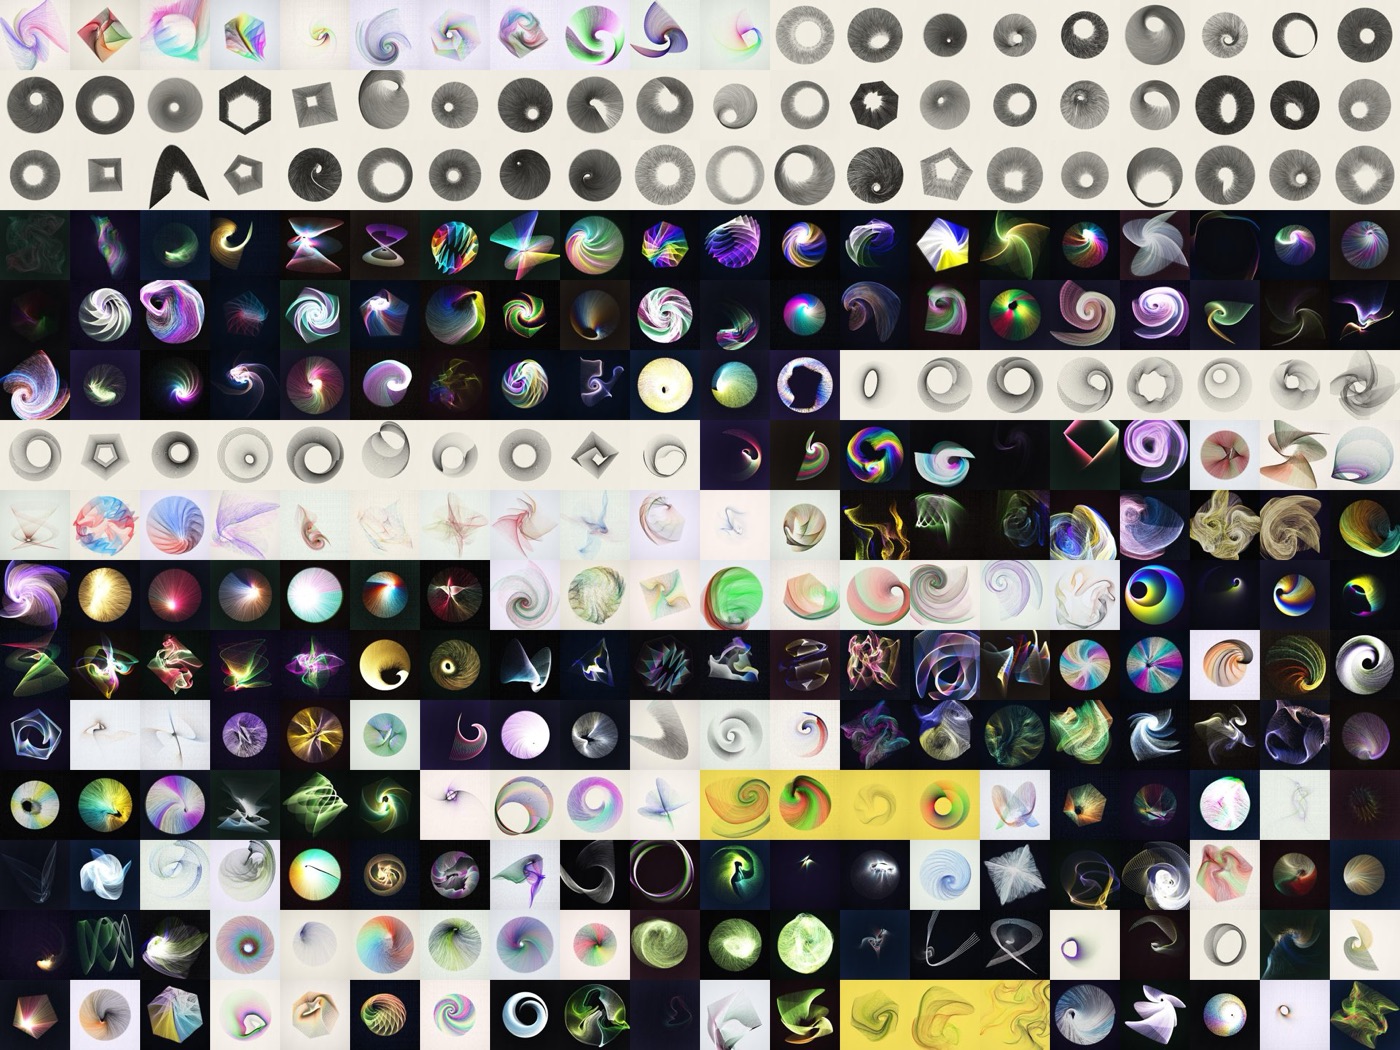
Now every number first picks a species, a behaviour with its own motion, mark and tempo, and only then its colours. Flow is the old look, now just one of eight. Orbit has bodies circling one to three centres, inner ones faster, as Kepler's third law says. Flock follows Craig Reynolds's Boids rules, with each mark coloured by its heading. Waves are stacked lines rippling in phase, after Bridget Riley. Grid is quiet ruled lines that barely tremble, after Agnes Martin. Growth is tips that wander and branch. Pulse is rings breathing out like ripples. And, rarely, constellation: drifting stars joined to their neighbours. Ink stays the plotter's species. ✦ new deals species from a shuffled deck, so you never see the same behaviour twice in a row.
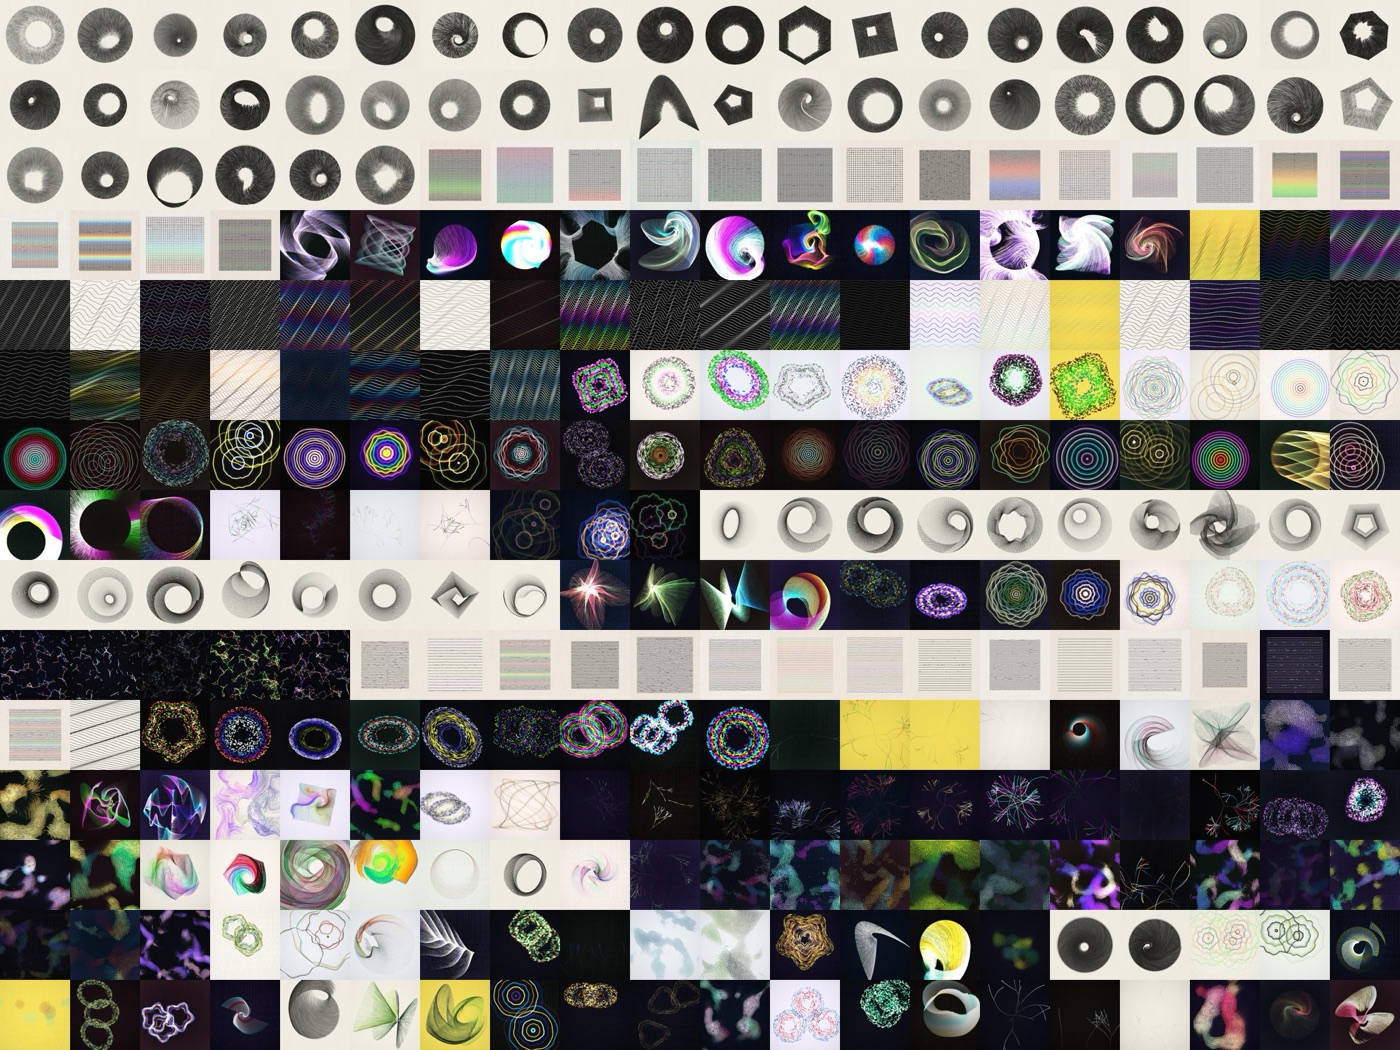
The numbers moved where it matters. Designs streaming inward fell from 61 % to 28 %, and almost all of those that remain are ink pieces, which are meant to contract. Average inward motion fell from 0.38 to 0.05, essentially none. One number didn't move: CLIP, an image model, still finds about the same count of visual groups, because it judges single frames by colour and ground, and it can't see motion. So the final judge is a card sort with people watching clips.
09Beautiful because it's true
The last family is real science, with the actual equations, not effects that look scientific. The Lorenz attractor: 1,500 copies of a weather-like system start a billionth apart and end up all over the butterfly. Drag ρ below 13.93 and the chaos disappears. The double pendulum: a fan of twins released a hair apart, which stay together just long enough to fool you. The figure eight: three equal masses chasing each other forever along one orbit, found by Moore in 1993 and proved by Chenciner and Montgomery in 2000. Fireflies: Kuramoto's oscillators flash at random until you raise the coupling past K꜀, and then they flash as one. The Chladni plate: sand thrown off the moving parts of a vibrating plate, gathering on the lines that stand still. Turing patterns: Gray–Scott reaction–diffusion on the GPU, growing spots or a labyrinth from a few drops.
Each opens with an ⓘ card: one sentence, the equation, the primary source, and one control that shows the idea. Every solver is checked against published numbers:
| check | published | wake |
|---|---|---|
| Lorenz largest Lyapunov exponent | ≈ 0.9056 | 0.90 |
| double pendulum energy drift, 10,000 steps (RK4) | < 0.1 % | 0.0008 % |
| figure eight: energy drift (Verlet) and closing after T = 6.32591398 | < 0.1 %, closes | 0.00002 %, closes to 10⁻⁶ |
| Kuramoto r above K꜀ = 2γ, at K = 1.5 / 2 / 3 | 0.577 / 0.707 / 0.816 | 0.576 / 0.707 / 0.817 |
| Gray–Scott: spots, labyrinth, extinction at their (F, k) | Pearson 1993 | 45 blobs / one connected labyrinth / none |
| GPU Gray–Scott against the CPU reference | identical | correlation 1.0000 |
The tests caught two of my own mistakes. I had claimed that below ρ ≈ 24.74 Lorenz twins stay together. Between about 13.93 and 24.74 there is transient chaos, and the test, run at ρ = 20, failed correctly. My parameters for a "worms" pattern were wrong too: it died out, so I removed it instead of guessing. A checklist for a physicist or mathematician to review every card is part of the project; until someone signs it, the cards say only what the tests can back.
10Proof
| claim | evidence | |
|---|---|---|
| It's mine, not a copy | jscpd token comparison of wake (compiled to plain JS) against uji's original source: 0 shared clones. A planted control was caught, which also exposed that jscpd silently skips files over 1,000 lines by default. | pass |
| Same link, same drawing | Byte-identical SVGs for every regression state, reloaded from the link; different seeds differ. Design numbers produce identical states in Node and in the browser. | pass |
| It looks the way it should | 25 Playwright visual-regression baselines (blocks, signals, seed shapes and collection pieces), about 70 automated tests in all. | pass |
| A link can't hurt the viewer | A hostile-link test: oversized values are clamped and injected markup never reaches the SVG. | pass |
| It's alive and never freezes | For 60 seconds the share of pixels changing every second stayed far above a 0.5 % floor, on a GPU and on software rendering. Visible motion within 1 s of every fresh visit (the two species that start almost still, growth and Lorenz, are never a visitor's first design). Playwright videos of the first 10 s on desktop and phone. | pass |
| A new design is one obvious action away | ✦ new is at least 150 × 56 px and on screen on desktop and phone; a tap and the space bar also work. Controls stay hidden until asked for. | pass |
| More than one personality | Same 300 numbers: inward-streaming designs 61 % → 28 %, mean inward motion 0.38 → 0.05, k-means families 2 → 3, CLIP diversity 0.190 → 0.213. 100 presses of ✦ new: no species twice in a row, all nine appear. | pass |
| The science is right | 7 solver tests against published values (above), GPU = CPU, every card has an equation, a control and a dated source; fireflies sync above K꜀ and stop below it. | pass |
| An expert agrees | Review checklist for a physicist or mathematician. | awaiting review |
| Strangers understand it | 60-second comprehension test, 5 people, pass at 3 of 5. | planned |
| People see the variety | Card sort: 5 people, 12 clips, target ≥ 5 groups and at most one "waterfall". | planned |
| Ink pieces plot | 100 of 100 ink designs pass the plot budget (≤ 45 min, density ≤ 1.5). | pass |
| 60 fps at 20,000 segments | 60 fps at 20,000 segments per step: Pixel 7 emulation, 4× CPU throttle, Apple M1 GPU. An emulation; the real-phone measurement is pending (open wake with ?fps). | emulated |
| It plots | Default drawing: 3.9 min, max ink density 0.8 (limit 1.5) on A4 with a 0.3 mm pen. SVG. | plot pending |
| A stranger can play it | The 10-second test (“Is this alive? How do you get a new one?”, pass at 4 of 5) and the 2-minute first-use test. | planned |
| Real devices hold up | Anonymous frame-time reports per device class from visitors. | collecting |
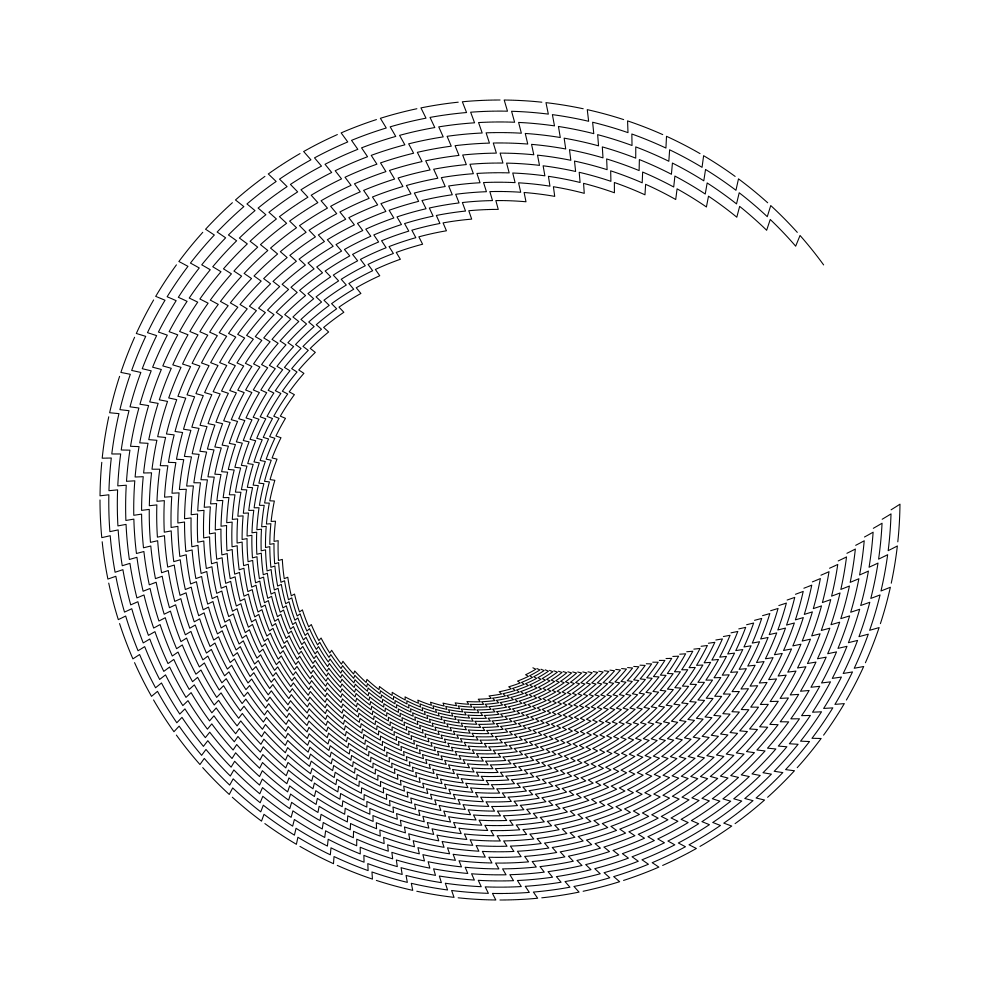
Every part of a line keeps its own clock, and the drawing is the record of them arriving, over and over, as long as you watch.
open wake →Full credits & sources → · source on GitHub
Inspired by uji by Noah Doersing. Drawing machines by Desmond Paul Henry and Vera Molnár's (Des)Ordres sit further back in the lineage.